Stock market winners and losers in one month in the US-Israel war against Iran
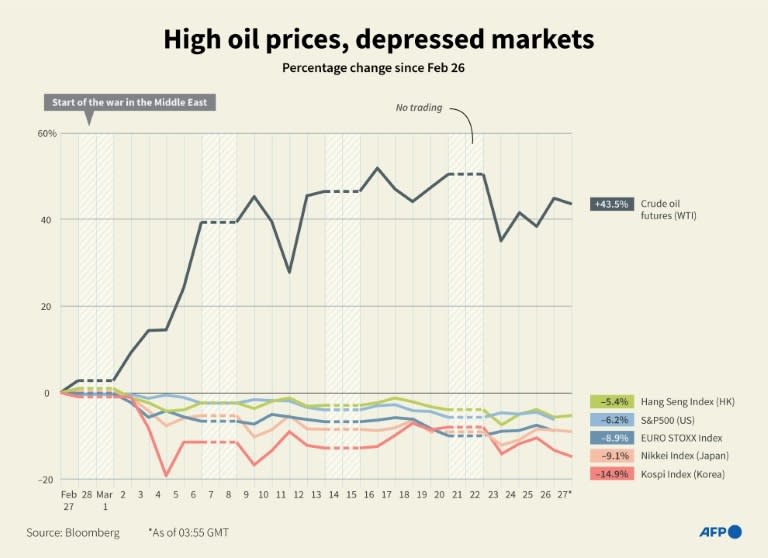
Infographic chart showing the performance of WTI crude oil futures against selected indices, as of March 26 and 27 at 03:55GMT. · AFP/AFP The US-Israeli attacks against Iran have triggered a series of retaliations and military escalation in the Middle East that has spooked global financial markets. The conflict, now more than a month old, … Read more